HLS and MPEG-DASH: playlists, descriptions and segments
A secondary reference concerning RFC 8216 links that document to HTTP Live Streaming (HLS) and describes playlists and segments as elements of its structure. This provides general guidance about the format, but it does not describe the contents of every playlist or tell you what happened during a particular session.
MPEG-DASH also appears in the MDN documentation consulted, on a page dedicated to DASH adaptive streaming for HTML5 video. That reference identifies the subject of the page, but it is not enough to detail the specification or compare it point by point with HLS. For that reason, it would not be appropriate to present technical requirements for DASH here as though they had been verified by the available sources.
A technical description can help explain which alternatives are published and how delivery is organized. However, finding a resolution option in a manifest does not by itself prove that the player selected it, received it without interruptions, or delivered a quality that corresponds exactly to that figure. A playlist is one part of the evidence, not a complete record of the session.
What player tools can reveal
HTMLMediaElement is a web interface documented by MDN for HTML media. That documentation describes a programming interface; it does not guarantee that every player exposes a diagnostic panel to users or displays data such as the selected representation or buffer status.
If you can access a manifest or technical panel, use it to answer limited questions: Which alternatives are listed? Does the representation change during playback? Does the buffer run empty near a pause? Record when the events occur and compare several changes rather than treating a single screenshot as conclusive proof. The manifest describes available resources; player information may describe part of its state. Neither one, on its own, necessarily explains why a decision was made.
It also matters who produces the data. A quality indicator may be a simplified label rather than an instantaneous reading of all network conditions. A value may update with a delay or refer to a representation rather than subjective quality. For a useful comparison, note the device, app or browser, automatic or manual mode, and when the problem occurred. Do not attribute precise numbers to something the tool does not measure.
Automatic quality is not a direct measure of your connection
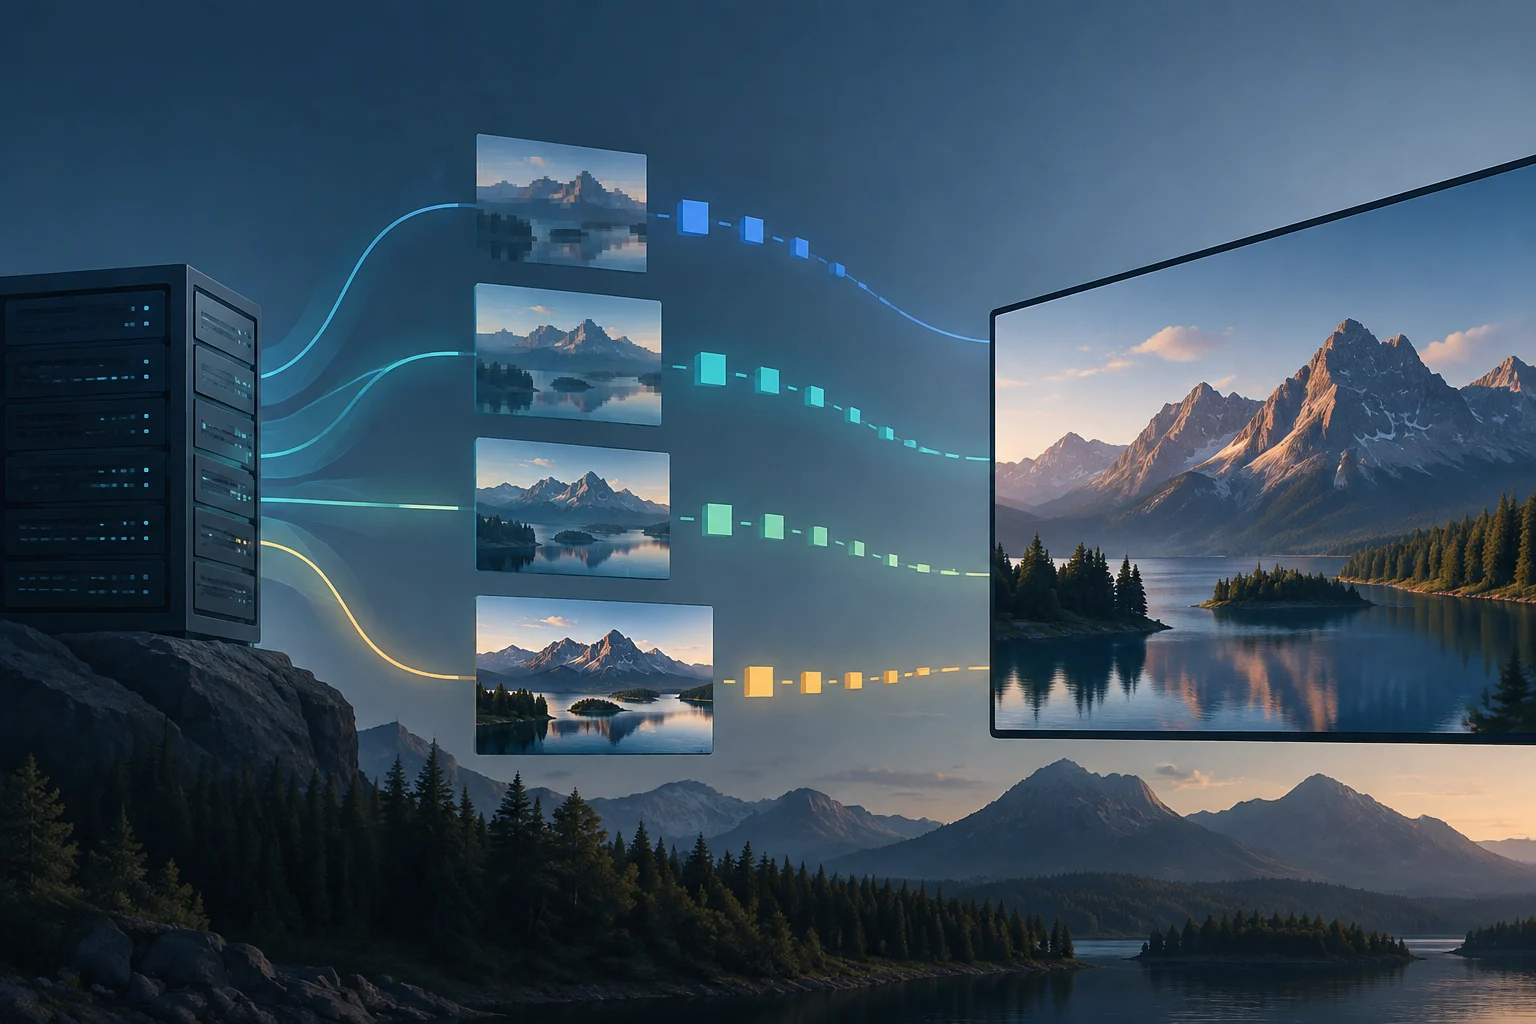
When a video changes from a crisp image to a softer one, it can seem as if the connection has deteriorated. But what you see is the result of several decisions: which versions of the video the service offers, which one the player selects, and whether the data arrives in time to keep playback going. Visible quality alone cannot identify which of those factors changed.
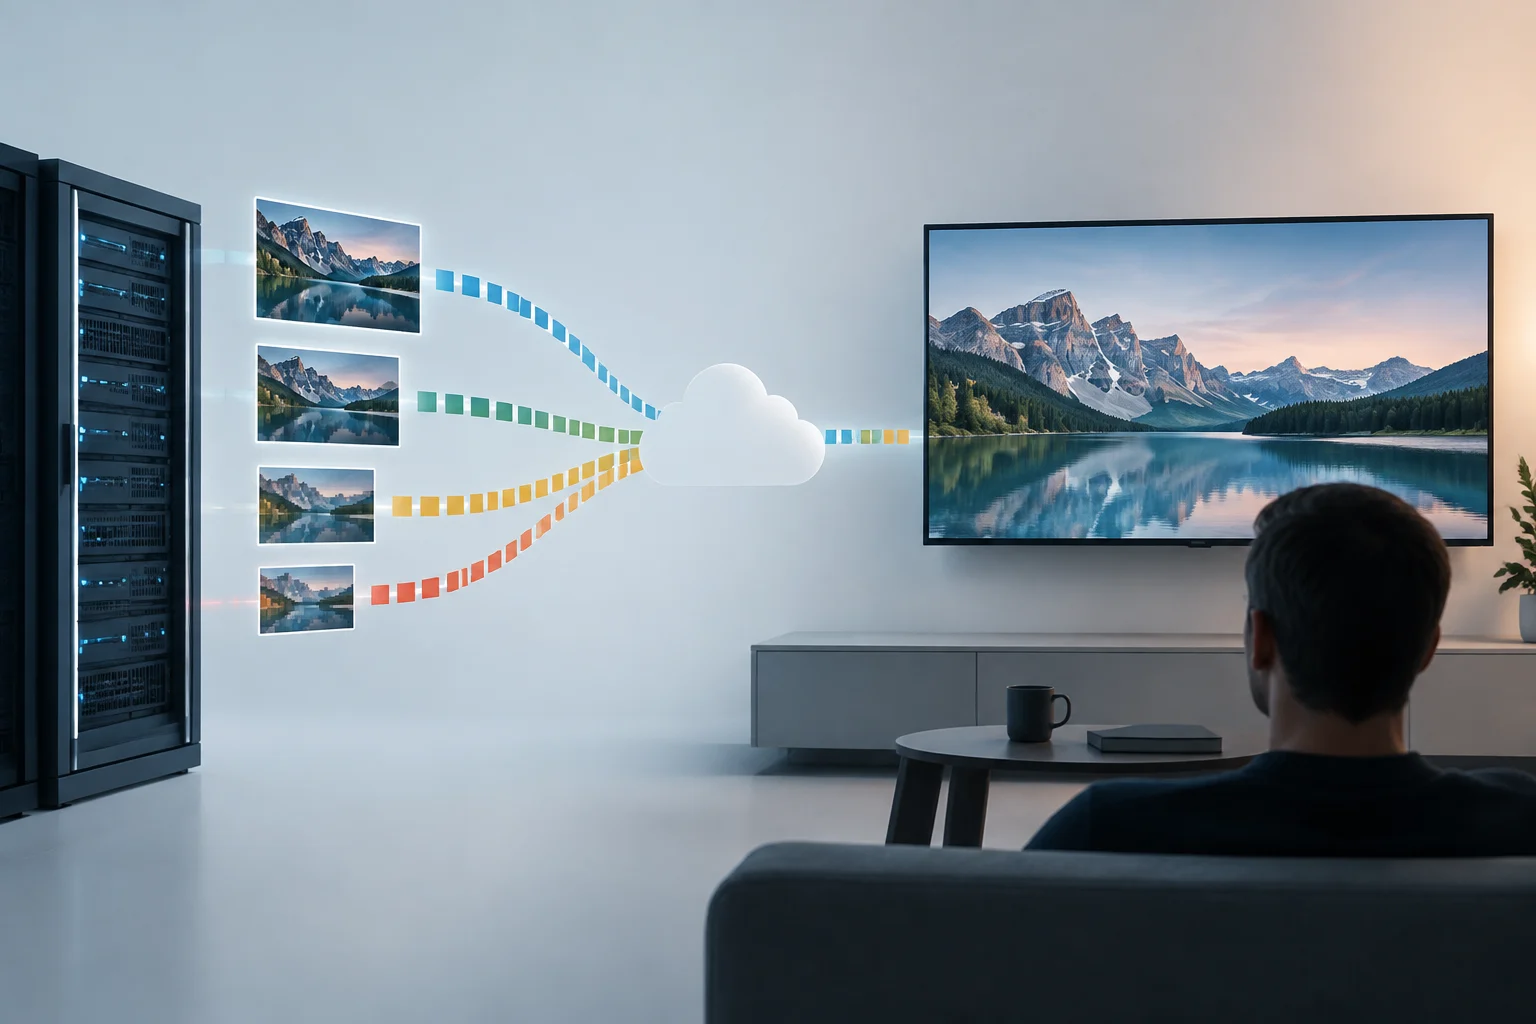
In adaptive streaming, the player can switch between representations of the same content with different characteristics, such as resolution or bitrate. Selection can change during playback, but that does not mean every service follows the same rule or makes its decisions visible to viewers. Without data from a specific session, you cannot attribute a visible change to a particular mechanism.
That is why it is useful to distinguish an observation from an explanation. “The image looks less sharp” describes something you can perceive; “my provider reduced the speed” is a hypothesis that requires more data. Playback can switch representations without a pause, and a pause can have a cause other than download speed. Adaptive describes one way of adjusting playback, not a guarantee of constant quality.
Resolution, bitrate and perceived quality are not synonyms
Resolution indicates image dimensions, but does not by itself describe all the detail that reaches the viewer. Bitrate expresses how much data is assigned per unit of time; it also does not, by itself, sum up the visual result. Codec, content, encoding and viewing conditions can all affect appearance. That is why two versions at the same resolution can look different, and a lower-resolution version may be more pleasing than another that was encoded less well.
In a scene with a lot of movement or texture, compression defects may be more noticeable than in a static scene. Screen size and viewing distance also change what a person perceives, even when the received data do not change. These observations help avoid a misleading equivalence between a menu number and a complete assessment of quality. Without additional measurements, they do not let you assign an objective score to a particular playback session.
A resolution figure is a clue, not a certificate. If a menu reports that video is playing at a certain resolution, that does not prove every frame maintains identical conditions or that the original source had that level of detail. Perceived quality summarizes a visual experience; resolution and bitrate are partial technical characteristics. It is worth naming each thing precisely.
What can cause a change, and what it does not prove
A quality drop may be consistent with changes in data delivery, but it may also be consistent with limits of the device, app or options published by the service. The verified sources do not let us attribute every change to a specific cause. Even when a less sharp image coincides with an unstable connection, the coincidence alone does not identify whether the source is the home network, the route to the service or a player decision.
Likewise, a pause does not automatically prove that the subscribed bandwidth is insufficient. It may be useful to check whether other services show the same symptom, whether the problem occurs on another device, and whether playback improves on a different connection. These comparisons help narrow down the context, but they are not definitive proof of a specific cause. Changing several conditions at once makes it harder to tell which one mattered.
The prudent conclusion should be proportional to the evidence: if the player lowers quality, you know that the visible presentation changed; you do not necessarily know why. If a panel shows that the representation changed and the buffer ran out, you have more specific clues about that session’s behavior, not a complete explanation of the network or service. Do not confuse a signal with a diagnosis.
Practical checks before changing settings
First, check whether quality is set to automatic or fixed manually. If it is automatic, the player may have room to vary it; if it is fixed, behavior will depend on the app and content. Option names and what they do can differ between services, so do not assume that two controls called “quality” work in the same way.
Next, repeat playback under comparable conditions: the same video, device and location, noting the time, whether there were pauses, and what quality the player showed. If possible, compare another device or a different connection, changing only one condition at a time. Improvement after changing networks supports the possibility that the connection environment has an influence, but it cannot by itself tell you which segment or component was responsible.
Finally, use diagnostic tools only for what they show. A current resolution reports one characteristic of playback; a list of variants reports published options; a buffer indicator provides context about continuity. None is a universal measure of internet quality. If the problem persists, gather that information and contact the relevant service. The most useful explanation is usually one that clearly separates what was observed, what is likely and what cannot yet be known.