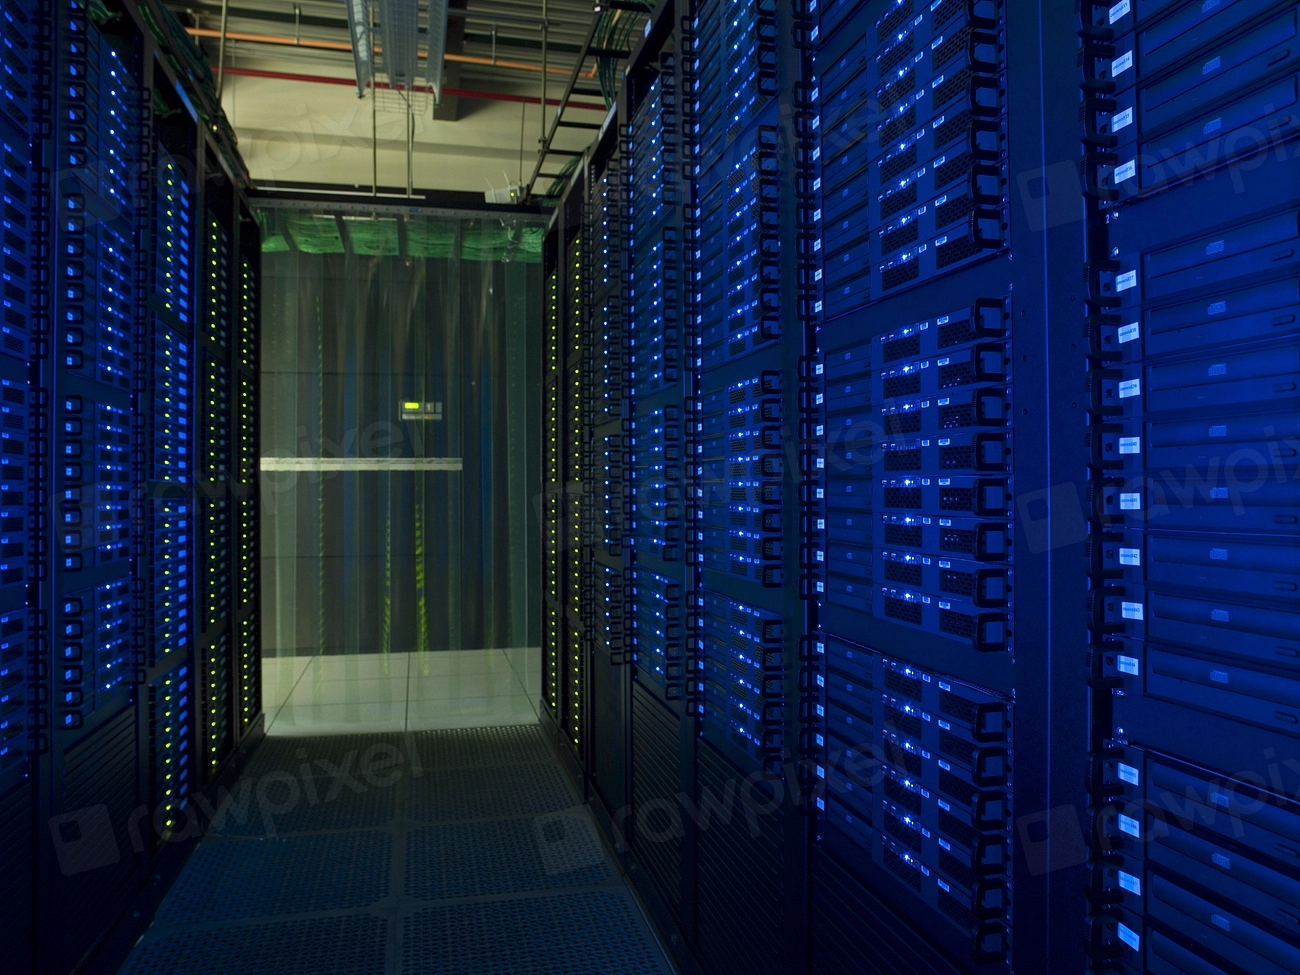
HPC: Many Tasks, Not One Measure
High-performance computing (HPC) brings together processing resources to solve problems that require more capacity or memory than an individual computer can usually provide. It is used, among other fields, in scientific simulation, analysis of large datasets, and modeling. The European Commission explains that supercomputers perform very large numbers of operations and that FLOPS expresses floating-point operations per second; it is a measure of computing capacity, not a complete description of what a machine will do for every task. Source: European Commission.
In an HPC system, results depend on how processors, accelerators, memory, storage, networking, and software work together. The supercomputing center LRZ notes that architectures have become more specialized and complex, a practical warning against the idea that two machines can be ranked by a single figure without considering their configurations. Source: LRZ. The useful question is not just how many operations a system claims to perform, but what work was measured and under what conditions.
What the TOP500 Ranking Provides
TOP500 is a public list that ranks systems by performance on the LINPACK test. Its main value is that it offers a comparable procedure for a defined computing workload. The list is not a general evaluation of every machine, nor does it necessarily represent how a system will behave with every scientific application. To interpret a position, identify the test and distinguish the measured score from the theoretical maximum that might be attributed to the configuration. Source: TOP500 FAQ.
TOP500’s documentation also invites system operators to submit data for the TOP500 and Green500 lists, indicating that the rankings are built from information submitted for evaluation. This makes it important to check the system profile, the edition or date of the list, and the declared conditions rather than citing only the rank. Source: TOP500/Green500 call for participation.
In practice, a responsible comparison separates three things: relative position in the edition being consulted, performance recorded in the test, and the scope of that test. The position answers a narrowly framed question, not a universal question of which system is the “best supercomputer.” A machine with a lower benchmark score might be better suited to a particular application because of its architecture, memory, software, or user availability.
Measured Performance and Peak Performance
FLOPS figures often appear in two senses that should not be confused: the performance observed while running a test and the theoretical peak performance calculated from hardware capabilities. The first figure depends on the system completing the benchmark; the second describes an idealized limit under operating assumptions. Neither replaces the other, and a system profile that gives only theoretical peak performance does not demonstrate what speed was achieved on a real workload. The European Commission defines FLOPS as floating-point operations per second, but interpreting a result still requires knowing what was run. Source: European Commission.
How the benchmark is run also matters: problem size, node configuration, compiler, libraries, operating mode, and test rules can all change the result. The materials available for this article do not include concrete records for a machine or a verifiable series of scores for comparison; for that reason, it does not present a ranking table, FLOPS figures, or a claim about recent changes. This does not prevent an explanation of the method, but it does prevent quantitative advantages from being assigned to specific systems.
To check a published figure, open the system’s entry in the relevant ranking and look for the measured result, the theoretical peak if reported, the processors or accelerators, and the submission date. Then compare those details with documentation from the operating organization or manufacturer. If the exact configuration or evaluation conditions cannot be found, the figure can be described as published, but not as a fully reproducible comparison.
Energy Efficiency: A Complementary Metric
Energy efficiency offers another perspective: it relates the performance obtained to the energy consumed during a measurement. Green500 publishes a complementary ranking focused on this dimension. However, a high efficiency position does not automatically reveal how much energy a center will consume over a year or how much it will cost to operate. The benchmark sample, operating mode, and measurement boundaries affect what the data represents. Source: TOP500/Green500 call for participation.
Research on the Fugaku supercomputer shows why performance and consumption can be analyzed together: the article studies both using SPEC HPC tests and examines low-power operating modes. It is research on one case and specific methods, not a basis for generalizing figures to all supercomputers. Source: academic article on Fugaku.
Estimating total cost requires additional data: energy use by the system and cooling infrastructure, actual utilization, electricity rates, maintenance, staffing, and initial investment. Efficiency measured during a test does not include all these components by itself. Efficiency helps compare a technical dimension under stated conditions; operating cost requires a different analysis, with an explicit time horizon and assumptions.

How to Check a Published Figure
Official documentation from the operator or manufacturer helps establish which configuration was evaluated, but it should not be confused with independent validation. A TOP500 profile documents the result submitted within the ranking framework; institutional documentation can confirm architecture and stated capability. When the two sources differ, determine whether they describe different dates, operating modes, or configurations rather than automatically choosing the more striking figure.
A useful check can follow this order:
- Note the list edition, date, and position; do not cite a rank without its time context.
- Identify the test and measured result, distinguishing it from theoretical peak performance.
- Record the declared configuration and verify it against official system documentation.
- For energy, check what power was measured and whether the figure corresponds to the same run as the performance result.
- When comparing a real application, look for published results for that workload, including software version and execution conditions.
From Benchmark to Scientific Application
A standardized test reduces some variability and makes it possible to rank systems on a defined task. A scientific application, by contrast, may be limited by communication between nodes, memory, storage, algorithms, or the ability to adapt software to processors and accelerators. The benchmark result therefore cannot, by itself, predict how long a particular simulation will take or how many researchers will be able to use the resource at once.
To assess a machine for a particular use, results from the application or a representative workload are needed. The evaluation should state the problem size, configuration used, code version, required precision, and whether the result measures execution time, performance per user, or consumption. If those details are unavailable, the prudent conclusion is that the benchmark provides a comparative signal, but not proof of performance in that application. There is no contradiction: the metrics answer different questions.
The ranking remains useful as a reference for performance under a known protocol; technical documentation helps explain the system, and energy metrics add context. What the evidence gathered here cannot support is a current ranking, a numerical comparison of specific machines, or an estimate of their total cost. Those conclusions require up-to-date profiles and comparable published data for each system.