
Using less material does not, by itself, prove a lower impact
3D printing, also called additive manufacturing, covers processes that create objects by adding material. There are different technologies and materials, so “3D printing” does not, by itself, identify a single process or a specific environmental profile. This distinction matters: comparing one particular technique, material or configuration with a conventional method does not support automatic conclusions about the whole category. Source: HP, 3D printing guide
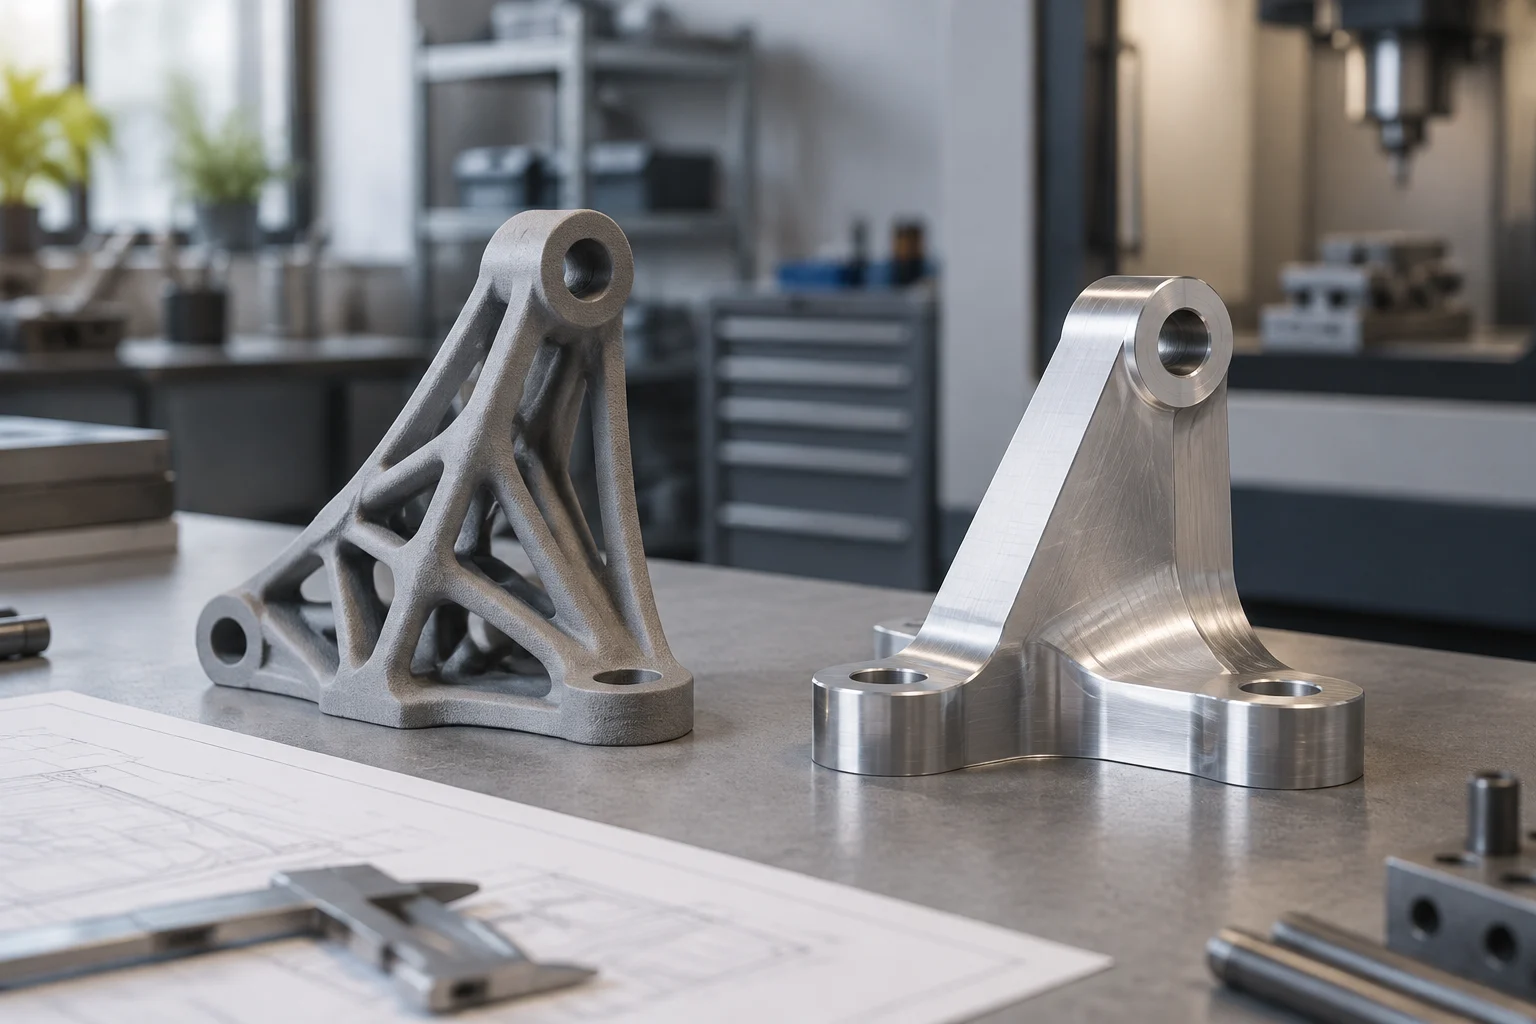
Additive manufacturing can reduce the material removed from a part during production, but that does not demonstrate that the complete product has a lower environmental impact. Reaching that conclusion requires, among other things, data on the input material, the parts that meet requirements, energy use and post-processing operations. It is also necessary to define what is being compared and which effects are inside the analysis. The useful question is not whether 3D printing uses less material in the abstract, but whether it delivers the same function with a lower impact in a described, verifiable scenario.
A rigorous comparison begins by describing the function the products must perform. The functional unit expresses the comparable service—for example, performing a task over a defined period—while the reference flow states how much product is needed to provide it. If function, quality or service period differ, a change in resources used could reflect a comparison of different services rather than an advantage of the manufacturing method. Defining the comparison is part of the environmental argument, not a secondary detail.
Define the boundaries before comparing
A life cycle assessment (LCA) must explain which parts of the system it examines. In a manufacturing comparison, the study may set boundaries around stages such as material acquisition, production and transport, and may also include use and end of life. The question being asked and the boundaries selected determine what the analysis can answer. An article or report should therefore state where the system under study begins and ends, and which processes it leaves out.
These boundaries make it possible to check whether two results address comparable questions. If one study includes transport and another does not, for example, their figures do not describe exactly the same scope, even if they concern a similar part. Identifying the stages prevents a partial assessment from being mistaken for a claim about the whole life cycle. An environmental claim can cover only the stages and conditions actually assessed.
Excluding a stage does not, by itself, invalidate a study, but it does limit the scope of its conclusions. If use has not been assessed, the result does not describe that stage; if transport is outside the boundary, the analysis alone cannot support a conclusion about the effects of distribution. It is useful to distinguish a stage that was assessed from one that could not be included, and to explain the reasons for exclusions. This lets readers see what the evidence covers and what remains outside the analysis.
The role of standards
ISO 14040 is presented as a framework of principles and reference for LCA; ISO 14044 is associated with its requirements and guidelines. These descriptions help place the standards in context, but they do not replace data from the specific process or determine which of two alternatives has the lower impact. Explicit choices about the study question, scope and exclusions are still needed for that comparison. Sources: Eurofins, ISO 14040; IPYC, ISO 14040 and 14044
Material, energy and post-processing
For materials, identify the substance or family used, how much enters the process and how much is incorporated into the final part. Also clarify how supports, auxiliary structures, failed parts and leftovers are counted when they form part of the scenario being assessed. The weight of the finished object alone does not indicate how much raw material was needed to obtain a part that meets its intended function.
Process yield helps interpret these quantities: if some of the output cannot be used, total material input does not reveal how many compliant parts were obtained. It is therefore useful to state what counts as waste, what is considered part of the product, and whether the data represent a part produced or a part that meets the requirements. Without these definitions, two figures that appear comparable may be measuring different things.
Energy use must be linked to the production being compared. An electricity figure per operating hour cannot, by itself, establish consumption per part: among other things, the process duration and the number of compliant products are needed. If the study converts electricity use into environmental impact, it should state which factors and energy context it uses. A clear comparison separates measured data from the choices used to interpret them, so readers can identify the origin of the result and the limits on applying it.
Prototypes, one-off parts and series production
Batch size can change which data are relevant. For a prototype or one-off part, it is useful to know what preparation the process requires and how many attempts or units are needed to obtain a usable part, if that information is available. In a production run, the number manufactured, the proportion of compliant parts, repeated operations and actual production conditions become important. The result for a small batch should not simply be transferred to a different scale.
The ability to make complex geometries or produce on demand can change which part is made, where it is made or how much inventory is kept. But these possible changes do not guarantee an environmental benefit. To examine them, a study has to describe a specific scenario and the alternative being compared: which process is genuinely avoided, how much is produced, and what happens to the part during use and at the end of its life. If the change relative to the alternative is not specified, it is unclear what effect is being attributed to the manufacturing method.
Products must also be compared when they provide an equivalent function and meet relevant quality and durability requirements. If a printed part and its alternative have different service lives, it may be necessary to compare how many units are needed to provide the same service. When these data are missing, it is better to state that as a limitation than to resolve it using an assumption favourable to one technique. The difference between an individual part and a production run is not just a matter of scale: it can change what evidence is needed to represent the service provided.
How to read a comparative study
Before interpreting a figure, check that the study defines the product, function and comparison unit. Then review the system boundaries, exclusions, data sources and assumptions. An assessment is more transparent when it distinguishes values measured directly from those taken from databases or literature, and from those based on modelling assumptions. Knowing where the data came from helps readers judge whether they are relevant to the place and process studied.
It is worth distinguishing the apparent precision of a number from the strength of the comparison that produced it. A detailed figure is not enough if it is unclear which product it represents, how the data were obtained or what conditions were assumed. Transparency makes it possible to identify which parts of a result depend on measurements and which might change if an assumption changes. This is a methodological limitation to explain, not a reason to treat findings from a particular case as universal.
Traceability also matters when a result is condensed into a single figure. The indicator selected, the categories considered and methodological choices all influence how the comparison is presented. It is more informative to review the method and disaggregated results than to accept a headline such as “X per cent more sustainable” without knowing the unit, scenario and uncertainties. A summary should make clear what is measured and under what conditions, rather than merely announcing which alternative comes out ahead.
Checklist for assessing a claim
A sustainability claim about 3D printing is more useful when it can answer specific questions. Readers do not need to repeat a complete LCA, but they should be able to identify what was compared and what evidence supports the conclusion. If essential data are missing, the prudent response is to narrow the claim or ask for more information, rather than assume that one technique is better in every case.
Before accepting a comparison, check the following:
- Equivalent function: Do the alternatives provide the same service, and are they compared using an explicit functional unit?
- Visible scope: Are included and excluded stages stated, and is it clear whether the analysis covers manufacturing, transport, use and end of life?
- Identifiable data: Are material and energy quantities, relevant waste and data sources explained?
- Complete process: Are the post-processing operations needed to obtain a usable part counted?
- Comparable scenario: Are batch size, compliant parts and production conditions specified?
- Proportionate conclusion: Is the claim limited to the case assessed, with its assumptions and limitations made visible?