
The Role of Semiconductors in Energy Conversion
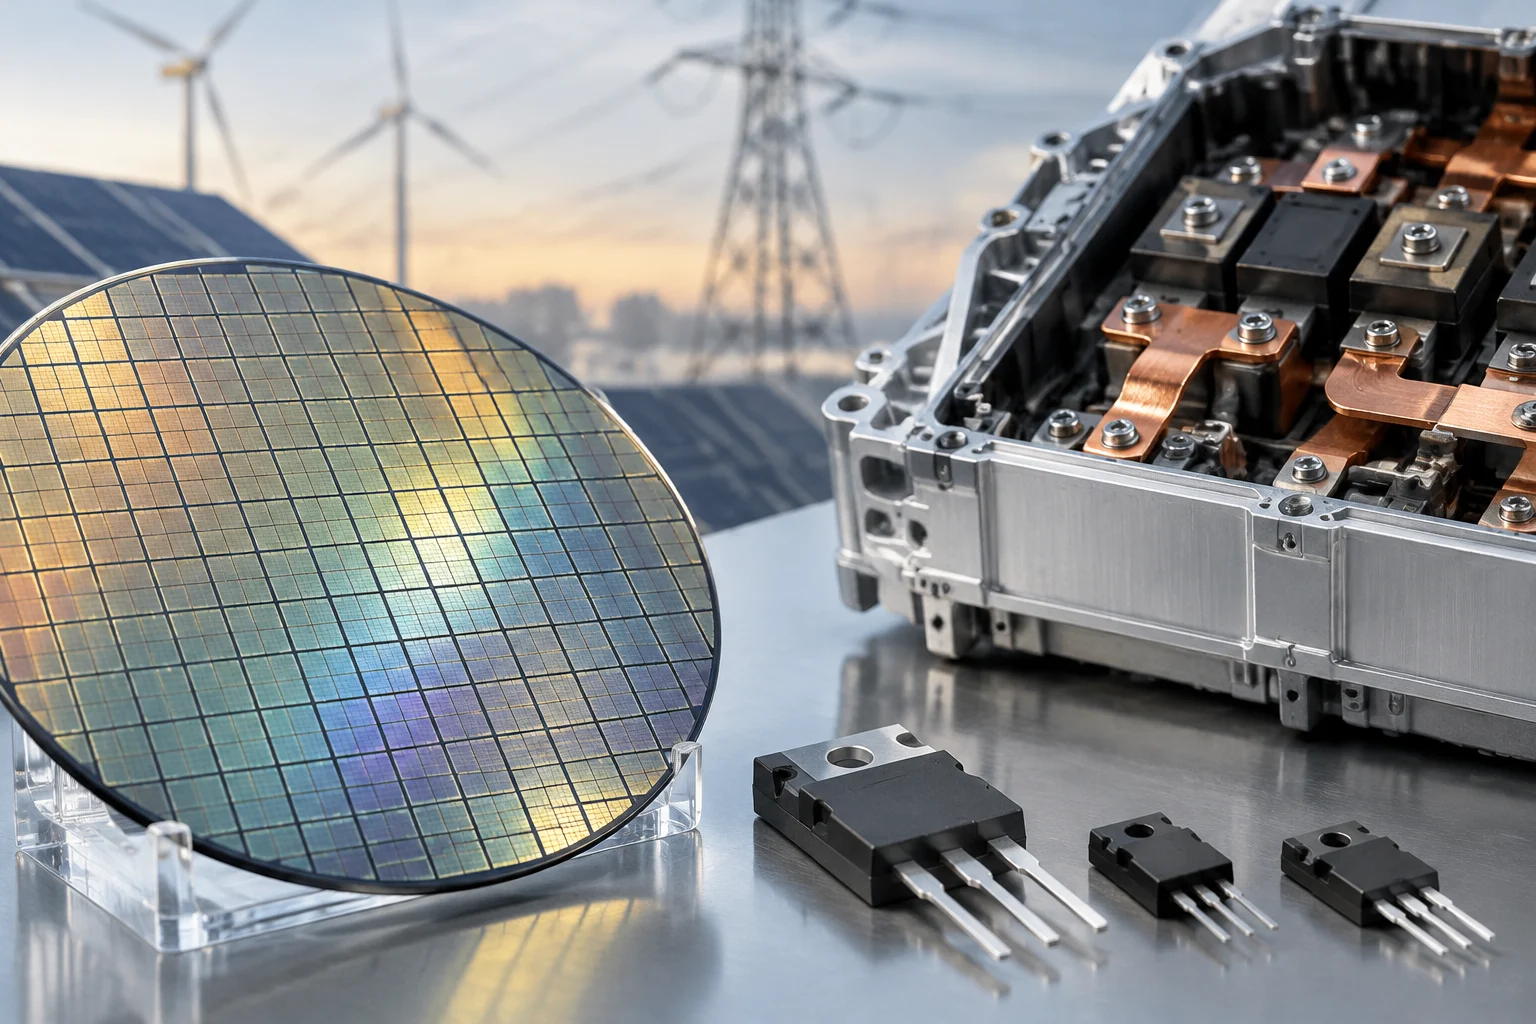
Power semiconductors enable the control of electrical flow in equipment that converts direct current to alternating current, or modifies voltage and current levels. In a photovoltaic inverter, for instance, transistors switch to produce an alternating current output from the continuous energy of the solar field. Final efficiency does not depend solely on the transistor; converter topology, control, passive elements, and cooling also play critical roles.
In a power grid with renewable generation and storage, converters connect sources and loads that do not necessarily operate with the same current or voltage waveform. The semiconductor's function is to open and close the current path in a controlled manner; energy is lost during each transition and conduction, primarily as heat. Reducing these losses can lower cooling requirements, although the actual benefit depends on how the complete equipment is designed and operated.
Therefore, it is advisable to separate three levels often mixed in commercial presentations: the physical characteristics of the material, the behavior of a specific device, and the performance of the converter or installation. A component improvement does not automatically equate to an equal magnitude improvement in the plant. Available sources describe principles and applications but do not offer a controlled comparison of complete systems that allows assigning a universal saving to each technology.
Silicon, SiC, and GaN: Different Materials, Design Decisions
Silicon IGBTs are a consolidated technology for power control. SiC —silicon carbide— and GaN —gallium nitride— belong to wide-bandgap semiconductors, a family that may be suitable for high voltage, temperature, or frequency conditions. The material's bandgap helps explain these possibilities, but it is not enough to rank technologies by efficiency: device structure, nominal voltage, current, temperature, and the operating circuit are crucial.
The type of transistor also matters. An IGBT is not simply interchangeable with a SiC MOSFET or a GaN device: each has distinct conduction and switching behaviors, and the design must consider these traits along with isolation, protection, and control requirements. A useful comparison starts by defining the application, operating point, and switching strategy, not by assuming a new material always wins.
Switching frequency illustrates the trade-off well. Increasing it may facilitate the use of smaller passive components, but it also increases the number of transitions per second and can raise switching losses. The provided sources do not substantiate a universal frequency range for SiC versus IGBT: these figures depend on architecture and operating conditions. A figure published for a specific piece of equipment should not be transferred to an entire technological category.
What to Look for in Datasheet Curves and Conditions
To estimate generated heat, it is convenient to first distinguish conduction losses from switching losses. In a MOSFET, conduction is related to its on-resistance and current; in switching, waveforms, coinciding voltage and current during transitions, as well as device and gate circuit capacitances, influence the result. The datasheet is only comparable if its test conditions are read, not just the highlighted value in a table.
When reviewing a datasheet, one must identify the junction temperature, current, bus voltage, on-resistance or conduction voltage drop, and turn-on and turn-off energy data, when published. It is also important to check the test circuit, gate resistance, and associated diode: changing these conditions can significantly alter observed losses. The data serve as a calculation basis, not as a promise of identical performance in any converter.
An initial calculation can combine conduction losses and switching energy per cycle with the operating frequency. This must then be contrasted with the thermal and electrical behavior of the real circuit. The superjunction MOSFET loss analysis included among the sources shows why modeling can become complex: nonlinear capacitances and current distribution affect waveforms. Simulation helps bound the design, but it requires representative parameters and conditions; it does not replace a validated prototype measurement.
Inverter efficiency changes with the load point and system state. Therefore, an isolated maximum or nominal figure does not reveal the performance during usual operating hours. Comparing equipment requires common conditions and a curve covering several load levels; evaluating an installation also requires considering auxiliary losses and standby consumption. If the source does not specify the measurement method, a reliable comparison cannot be reconstructed solely from the announced percentage.
Applications: What Available Evidence Demonstrates and Does Not
A grid-relevant application is medium-voltage photovoltaics. Coverage published in January 2026 describes the PVgoesMV project, led by Fraunhofer ISE, which explores 3 kV string inverters and pilot plants. The approach seeks to reduce interconnection materials, including copper and aluminum. It is a project under evaluation, not evidence that the semiconductors used have already produced a measured reduction in losses in a commercial grid.
The 3 kV figure describes the system voltage considered in that project; by itself, it does not inform about inverter efficiency, the exact transistor type, or the energy saving obtained. Supporting such conclusions would require published results with methodology, operating conditions, and reference comparison. It is therefore advisable to separate the engineering motivation —reducing materials in connections— from a quantified claim about efficiency.
SiC and GaN are also discussed in energy converters for high-demand facilities, including data centers. The gathered sources raise efficiency and power density as relevant issues but do not provide independent measurements of an installation that allow concluding how much a specific architecture saves. A possible application is not the same as a verified deployment, and a manufacturer or supplier description must be read as interested information unless independently corroborated.
From Transistor to System: How to Set Up a Useful Verification
A practical evaluation must first fix what is to be compared: semiconductor loss, converter efficiency, or net installation energy. For the first level, datasheet data and loss calculations under defined conditions can be used. For the second, input and output measurements of the equipment are needed, with a method including the relevant load range. For the third, auxiliary elements and the operating profile must also be accounted for. The measurement boundary determines what the result means.
A brief list helps avoid misleading comparisons:
- Note voltage, current, temperature, frequency, and control conditions of the data used.
- Separate conduction losses, switching losses, and converter auxiliary losses.
- Compare technologies with the same topology, power, and load profile, or explain the differences.
- Distinguish simulation results, laboratory measurements, and field operation data.
- Request the test protocol and measurement uncertainty when an efficiency figure is published.
Instrumentation must also correspond to the question. A specialized analyzer can characterize certain semiconductor parameters and support diagnostic tasks in power equipment; that capability does not automatically turn an inspection into an independent certification of efficiency or lifetime. Measuring a component and validating installation performance are distinct tasks. Available sources do not document a specific certification scheme that allows asserting a technology is more efficient in all grid conditions.
For engineering and maintenance, the reasonable decision is not to choose by material label, but to check if the device meets the electrical and thermal requirements of the design and if the expected saving appears at the level that matters. Loss curves, test limits, and load profile allow discarding incomplete comparisons; a full converter test allows contrasting the calculation. When comparable measurements are absent, the conclusion must be bounded: one can speak of technical potential, not a demonstrated operational gain.