The Tension Between AI Growth and Decarbonization
The expansion of artificial intelligence requires data centers, electrical grids, and cooling systems. Therefore, assessing its environmental impact is not just about counting processors or measuring the electricity of a model: one must also determine where the work is executed, what infrastructure supports it, and with what sources it is supplied. The practical question is whether the increase in capacity is offset by efficiency improvements or if total consumption continues to rise.
The debate often mixes three different magnitudes: the consumption of all data centers, the consumption of facilities dedicated to AI, and the electricity associated with a specific task or service. These are not interchangeable categories. A projection on data centers as a whole does not by itself demonstrate how much AI consumes; a global AI estimate also does not allow deducing what part corresponds to the European Union.
Companies that buy cloud capacity, train models, or integrate AI services need operational information that aggregate figures do not offer: consumption attributable to the workload, location, facility efficiency, and emissions linked to electricity. Without that breakdown, an improvement in consumption per calculation could coexist with an increase in absolute consumption if many more tasks are executed. The distinction between intensity and total volume is central for planning costs, capacity, and climate goals.
What Available Figures Say and What They Do Not Allow Concluding
A coverage published in September 2026 attributes to the International Energy Agency (IEA) an estimate of 485 TWh of data center electricity consumption in 2025 and a projection of around 950 TWh for 2030, close to 3% of global electricity demand. The same coverage indicates a 17% growth in 2025 for data centers, compared to 3% of global electricity demand. These are figures for the entire data center sector, not an exclusive measurement of AI facilities.
A study published in Nature addresses a narrower scope: it calculates that the electricity used by data centers built for AI could pass from about 118 TWh in 2024 to between 239 and 295 TWh in 2030, approximately 1% of global electricity demand. The article also points out that the projected capacity is concentrated mainly in North America, Western Europe, and Asia-Pacific. The range expresses scenarios, not an observed counter of future consumption, and its result depends on the research assumptions.
The two global figures do not necessarily contradict each other: one contemplates data centers in general and the other facilities oriented to AI; moreover, they start from different years and methods. The 3% figure should not be presented as the percentage attributable to AI, and the 1% from the study does not represent a specific EU estimate. Available sources do not include a primary European Commission projection supporting the 13% cited in the initial premise. Therefore, that percentage cannot be used as an official data point or as a basis for calculating a divergence between Brussels and the industry.
A historical figure for the EU also circulates: 76.8 TWh in 2018, equivalent to 2.7% of electricity demand, and a projection of 98.5 TWh for 2030. The available source is a secondary guide that attributes those values to European documentation; it is not the primary Commission publication nor does it break down AI consumption. It should be read as a historical sector reference, not as an updated measurement or a projection that necessarily incorporates the rise of generative AI.
Hardware and Cooling: Efficiency Does Not Equal Lower Total Consumption
AI accelerators can perform parallel calculations and are part of the infrastructure that determines performance and energy consumed. However, comparing chips by an isolated figure is not enough: the result depends on the task, required precision, equipment utilization, software, and execution time. For an organization, the useful question is how much electricity and how many emissions a comparable workload requires, not which processor offers an efficiency figure under different conditions.
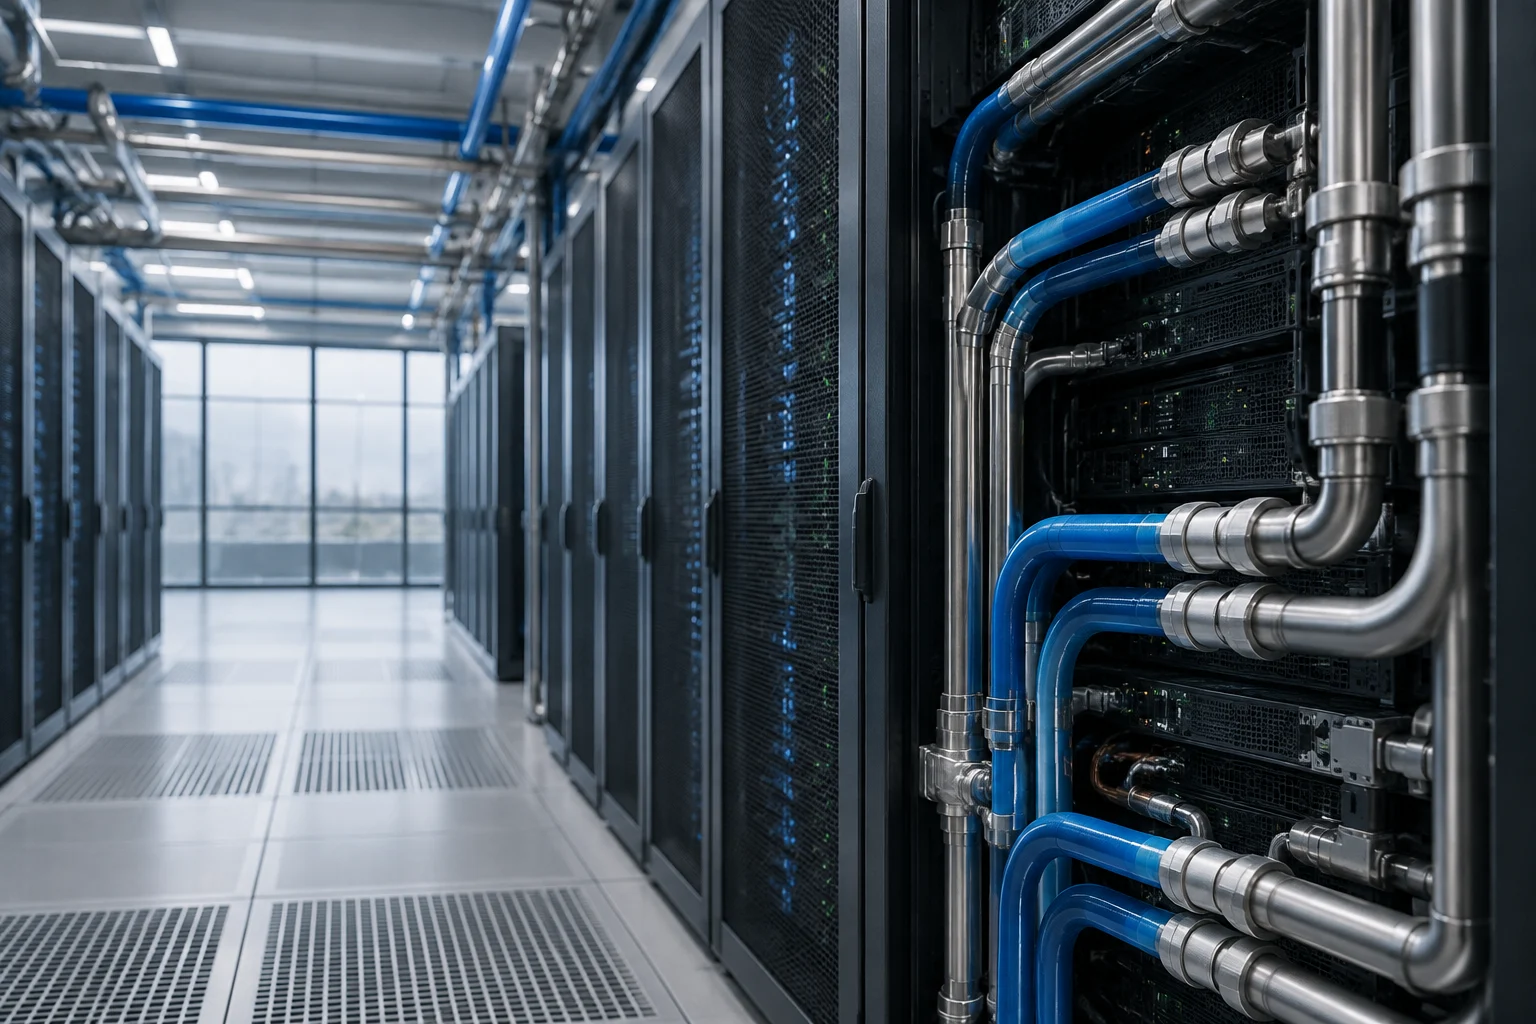
Cooling adds another layer. Server heat must be evacuated to maintain operating conditions, and available solutions can trade off electricity consumption and water use. A business source summarizing external references states that evaporative cooling can reduce electricity used compared to dry alternatives, but presents a wide and context-dependent range. That interval should not be treated as a universal guarantee: climate, design, load, water availability, and measurement limits change the balance.
Therefore, PUE and WUE provide different information. PUE relates the total energy of a facility to the energy consumed by its IT equipment; WUE relates water use to IT energy according to the applied definition. Neither, taken in isolation, reveals the complete emissions of an AI task nor resolves the choice between water and electricity. It is advisable to look jointly at total energy, IT energy, water, electricity mix, and useful system production.
Location matters because two facilities with similar equipment can operate under different climatic conditions and electrical grids. Nature research highlights that planned capacity is concentrated in several regions and that pressure on electrical systems can vary locally. Thus, the global total does not by itself inform about connection limits, power availability, or the water impact of a specific facility. To decide where to host a load, one must contrast provider information with regional and site data.
Scenarios: Checking Efficiency Against Demand Growth
In a favorable scenario, efficiency improves in servers, models, and operations, while computing demand grows at a pace that allows reducing energy per task and containing total consumption. Cooling optimization and load management can contribute, but the result must be demonstrated with comparable data. A performance improvement per watt does not, by itself, prove that the data center consumes less electricity overall.
In the opposite scenario, the increase in use and capacity exceeds efficiency gains: more total energy is needed even if each operation is less intensive. The cited research projects an increase in AI data center consumption between 2024 and 2030, but does not allow asserting by itself what will happen in each company or what percentage of the increase will correspond to a specific application. These are scenarios for evaluating risks, not guaranteed business predictions.
The way to distinguish both paths is to fix a functional unit and a measurement limit. For example, an organization can track the kilowatt-hours associated with a defined task, along with the volume of tasks executed in the period. If consumption per task falls but the number of executions increases, the total could grow; if intensity drops and volume remains stable, the improvement could translate into less absolute consumption. The comparison requires maintaining the same attribution criterion and recording changes in model, hardware, and location.
For purchasing decisions, investment in capacity announced by providers does not replace operational data. Capital expenditure figures collected in the press may indicate sector expansion, but they do not directly quantify the electricity consumption of a service, a region, or a data center. It is more useful to ask the provider for measured indicators, their period, and their scope, and to review if comparisons include cooling, power losses, and contracted or consumed electricity.
What Companies Should Measure and How to Interpret Their Limits
The first priority is to separate own consumption from the consumption of contracted services. For third-party managed infrastructure, one must request from the provider the energy attributable to the service, the allocation method, the relevant location, and the period covered. If only a global average or a label without methodology is offered, the footprint of a specific load cannot be verified with precision. The quality of attribution matters as much as the chosen indicator.
A practical tracking dashboard can include energy, water, and emissions, in addition to the volume of work done. PUE helps understand the overall efficiency of the facility; WUE informs about the relationship between water and IT operation; and emission intensity depends on how electricity is accounted for. For data to serve a decision, they must be accompanied by definitions, organizational and operational limits, dates, and sources of emission factors. The Ministry for Ecological Transition guide explains the delimitation of the organizational footprint and the calculation of scope 1 and 2 emissions.
European regulation contemplates information obligations for certain data centers. A secondary source on the current framework describes the 500 kW IT power threshold and the publication and reporting requirements linked to Directive (EU) 2023/1791 and Delegated Regulation (EU) 2024/1364. The exact scope, calendar, and national application must be checked in legal texts and the competent authority: it is not correct to turn that reporting obligation into a generic obligation for any company using AI.
In practice, a supplier review can raise these questions before expanding a workload:
- What consumption is attributed to the task and with what method?
- What facility or region hosts the service and what period do the data cover?
- Is total electricity, IT energy, water, and emissions reported, or only a part?
- Does the comparison keep the model, load, and service level constant?
- Are the values measured, estimated, or projected, and who verifies them?
The answers allow separating a technical improvement from a demonstrated environmental reduction.
Conclusion: A Measurement Gap, Not a Single Figure for the EU
Available sources describe a significant growth in data center consumption and a projected increase in electricity destined for AI facilities. But they do not substantiate an official European Commission figure stating that AI will represent 13% of EU electricity consumption in 2030, nor do they allow comparing that assumed percentage with unidentified business estimates. The prudent conclusion is that a comparable European breakdown of AI-attributable consumption is missing.
For companies, the decision is not to wait for a perfect statistic to appear. They can demand from their providers data with clear scope and methodology, measure energy per unit of work, and review total consumption, water, and emissions in parallel. For those operating data centers, location, cooling, and reporting obligations are part of the capacity analysis. For those buying services, the transparency of that data must weigh in the selection and monitoring of the provider.
A sign of progress will be that published series allow distinguishing the electricity of data centers in general from that corresponding to AI loads, with regional breakdowns and reproducible methods. A sign of regression will be treating global projections or partial metrics as if they described the footprint of a company or the entire EU. Until that level of detail exists, it is advisable to present figures with their scope and year, and not to confuse efficiency per task with total consumption reduction.